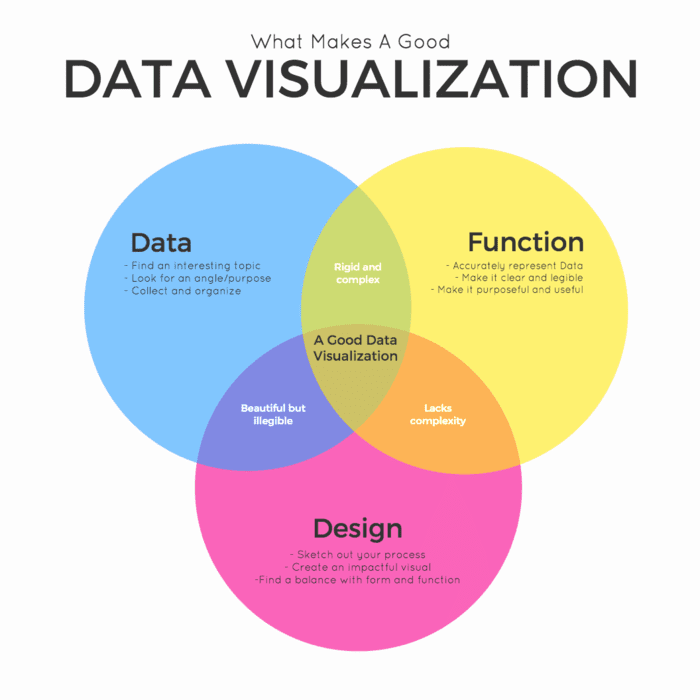
data visualization, commonly referred to as “data viz,” has become a crucial component of how companies run, interact with their workforces, and make decisions. It’s a communication tool that makes it possible to convey and comprehend complicated relationships and ideas in a clear manner. The majority of us are familiar with various types of data visualization, including charts, graphs, images, and maps.
Although data visualization can aid in the reduction of complex data, it can also oversimplify information, which can make decision-making more difficult. To ensure that your company completely understands how to use data visualization efficiently, read on to learn more about the disadvantages of this technique.
Cons of Data Visualization
Every technology has flaws, and data visualization is no different. These are a few instances of how it may fail:
1. It provides an estimate but no accuracy
Although the data can accurately forecast circumstances, the visualisation just provides an estimate. Although it is simple to translate dense and lengthy data into an understandable graphical style, this type of information representation can occasionally result in speculative conclusions.
2. False correlations
Correlating your data can be crucial for decision-making and strategy formulation, but it also has the potential to lead individuals to believe misleading associations exist. Visualizations can erroneously depict how several variables behave in relation to one another depending on the integrity of your data and the person interpreting the data. Incorrect assumptions and conclusions may come from the identification of spurious correlations among the data.
3. Too much Data
What to include vs what to cut in the pursuit of clear communication is a perennial design conundrum. Data visualization is hardly an exception, especially when the data is plentiful and stimulating. The issue? The ability of humans to interpret numerous values abstracted in visual form is limited.
When visualisations contain an excessive amount of data, the information becomes overwhelming and melts into a graphic soup that most viewers find intolerable.
4. Bias
Because human interaction is a fundamental component of data visualization, the data that serves as its foundation may be biased.
The individual collecting the data may only consider the pertinent information or the information that requires attention, leaving out the remainder of the information, which could result in biased findings. If the visual used is vague, it also leaves the interpretation of it open which gives way to biases i.e. the reader looking for the data to say what they want.
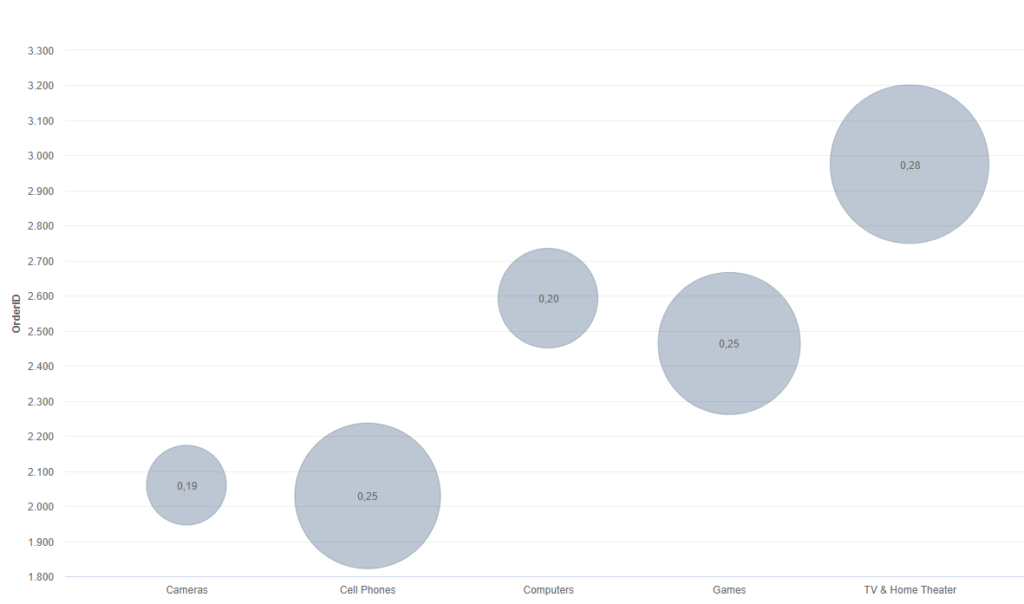
5. Axes Make the Difference
It is simple to alter how data is understood by adjusting the size and number of axes in a data visualisation like a graph or chart. The magnitude of an axis can first lead observers to believe that there is a more severe change or value than there actually is. Dual axes can also deceive the reader into thinking that two variables are calculated on the same base unit when they are not.
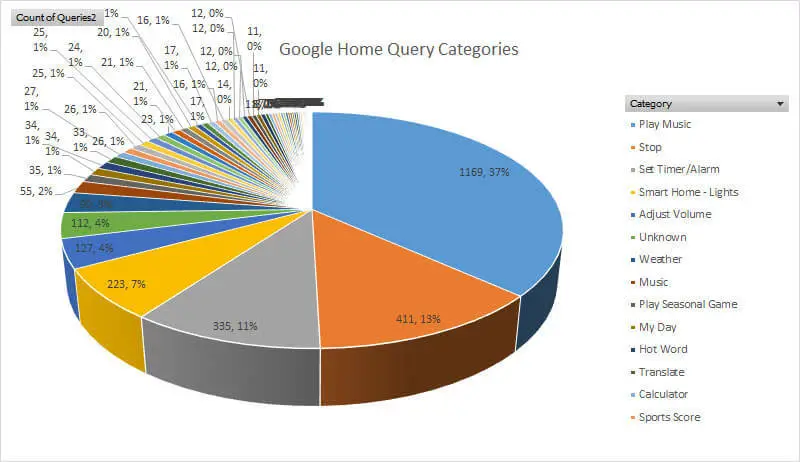
6. Choosing the Wrong Visualization Method
Each type of data visualisation has certain use cases. Pie charts, for instance, are used to compare the various components of a whole. They perform well for survey results and budget breakdowns (same pie), but they aren’t designed for comparisons across different datasets (different pies).
While a pie chart may be used to show earnings from different product verticals within a company to look at earnings from 3 rival companies we may use a bar chart. A line chart would be preferable to a bar chart if the visualization’s goal was to depict income changes over time.