Process Mining
The Datellers Process Mining Visual turns your event data into an interactive process map, showing exactly how work flows from first step to last.
Key features
- Interactive process map, first step to last
- Exception branches like cancellations shown
- Hover for activity frequency and average duration
- Golden Path and variant analysis
- Zoom and minimap for large maps
Brush Slicer
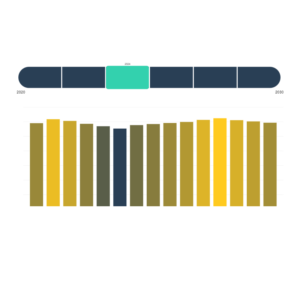
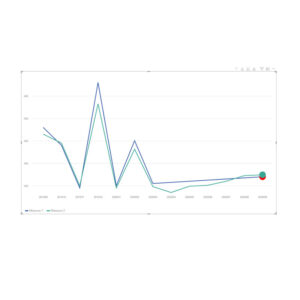
The Datellers Brush Slicer is a powerful slicer that lets you seamlessly explore trends, filter time ranges, and uncover insights through interactive brushing and dynamic visualization.
Key features
- Drag across the chart to select a date range
- Multiple Measures: layer metrics like Actual vs Target inside the slicer
- Period Snapping to free, year or month boundaries
- Precision Zooming into dense time series
Data Play
The Datellers Data Play allows you to animate data stories with intuitive playback controls and a precision timeline scrubber.
Key features
- Playback controls that animate your data story
- Scrubber navigation with hover previews
- Custom UI: match buttons, captions, colors and icons to your brand
- Sort By field and full drill-down support
Sunray Chart
The Datellers Sunray Chart makes it effortless to visualize workflows, track progress, and understand performance across every stage.
Key features
- Converging and diverging flows for workflows and customer journeys
- Customizable node icons for categories, tasks or statuses
- Custom Sort by date, score or your own rules
- Works inside Power BI with no add-ons
Bar of Pie
The Datellers Bar of Pie moves the smaller slices of the pie into a separate stacked bar chart.
Key features
- Select Top N slices to show in the main pie chart
- Remaining slices grouped into an “Other” slice and a stacked bar chart
- Subgrouping: click a slice to see its child elements in a separate bar
- Optional animation with a custom duration in milliseconds
Nested Total Bar Chart
The Datellers Bar of Pie moves the smaller slices of the pie into a separate stacked bar chart.
Key features
- Total value of each category shown in a separate total bar
- Nested bars under the total show the breakdown by legend series
- Dual-layer view: total bars and series bars in one chart
- Cleaner and easier to read than cluttered stacked bars
FactoryBI
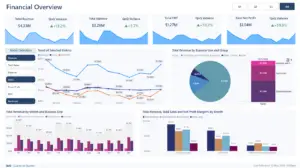
The Datellers FactoryBI turns the data already sitting in your ERP, Tally and machine logs into a live view of what’s slipping on the floor, and what it’s costing you.
Key features
- Production Analytics: OEE, downtime causes and shift performance
- Quality Analytics: defect trends and first-pass yield
- Inventory & Sales: ageing, scrap and demand-supply gaps
- Financial Analytics: cost per unit and margin by product
PBI VizFinder
PBI VizFinder makes the Power BI custom visual marketplace easier to explore. Search, filter, compare and discover the visual that fits your report.
Key features
- Fuzzy search across visual names, publishers, descriptions and tags
- Combine filters like type, certification, price, rating and publisher
- Sort by popularity, rating, reviews or dates
- Clear pricing: free and paid options visible at a glance