Author name: Muskan Bansal

Reasons to use Microsoft Power BI

7 Reasons to Use Microsoft Power BI

Microsoft Power BI is a powerful business intelligence tool that helps you visualize, analyze, and share your data in a way that is both meaningful and actionable. There are many reasons why you should consider using Power BI, including its data visualization capabilities, data integration features, customizable dashboards, real-time data analysis capabilities, collaboration tools, mobile […]

7 Reasons to Use Microsoft Power BI Read More »

facts about data visualizations

Top 7 facts about data visualizations

Data visualizations are powerful tools for presenting complex information in an easy-to-understand format. They can be used to communicate insights, trends, and patterns in data, and are essential for decision-making in many fields, including business, science, and public policy. Here are some key facts about data visualizations: 1. Data visualizations are effective tools for communication

Top 7 facts about data visualizations Read More »

Interactive data visualization for business intelligence and dashboards

Interactive data visualization for business intelligence and dashboards

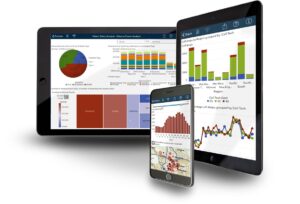
Interactive data visualization for business intelligence and dashboards is a powerful tool that helps businesses gain insights and make data-driven decisions. It involves using graphical representations of data that can be interacted with by users to explore and analyze data in real time. This type of visualization allows for creation of dynamic and informative dashboards

Interactive data visualization for business intelligence and dashboards Read More »

Importance of storytelling in data visualization

The Importance of storytelling in data visualization

Storytelling in data visualization is a critical aspect of effectively communicating insights from data. The combination of visual representations and storytelling creates a powerful tool for conveying complex information to a broader audience. With storytelling in data visualization, data becomes more accessible and understandable, allowing decision-makers to make informed decisions. Incorporating storytelling in data visualization

The Importance of storytelling in data visualization Read More »

Custom visualisation trends over the years

Top 7 Custom visualisation trends over the years

Over the years, data visualization has become an integral part of data analysis and reporting. As data sets grow increasingly complex, custom visualizations have evolved to provide a better understanding of data. From interactive visualizations to virtual reality visualizations, new trends continue to emerge in the world of custom visualizations. In this article, we will

Top 7 Custom visualisation trends over the years Read More »

data visualization

What are the disadvantages of data visualization?

data visualization, commonly referred to as “data viz,” has become a crucial component of how companies run, interact with their workforces, and make decisions. It’s a communication tool that makes it possible to convey and comprehend complicated relationships and ideas in a clear manner. The majority of us are familiar with various types of data

What are the disadvantages of data visualization? Read More »

Data management and its basics

Managing data involve a lot of different ideas and variables, which can get confusing.  However, data can help small teams increase sales, productivity, and customer satisfaction. For gathering, storing, maintaining, and integrating your data, there are numerous simple-to-use SaaS, iPaaS, and cloud-based services available. Exactly, what is data management?  Why is it significant, too? What

Data management and its basics Read More »

Scroll to Top

Get In Touch

Set up a free Consultation today!