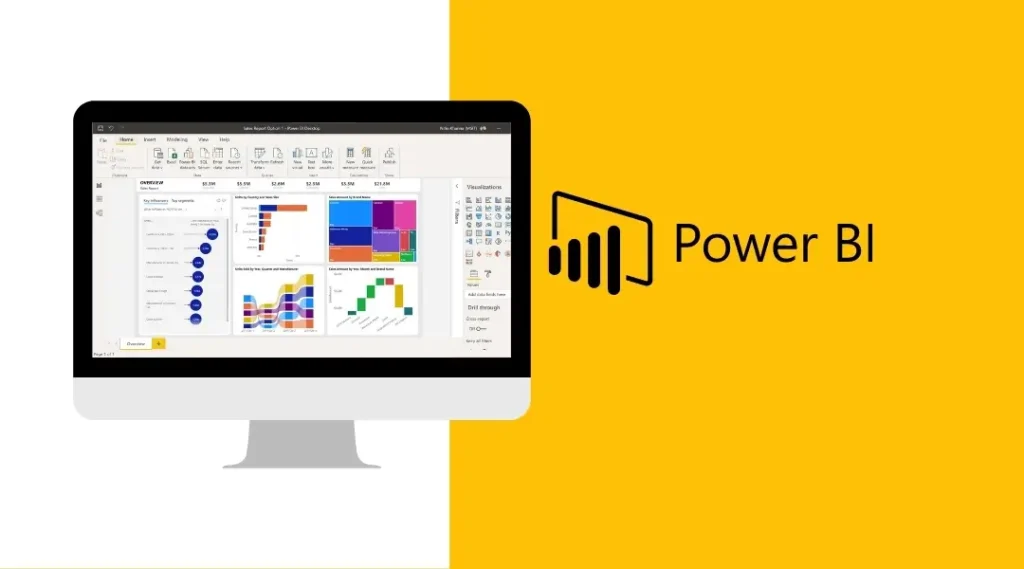
7 Reasons to Use Microsoft Power BI
Microsoft Power BI is a powerful business intelligence tool that helps you visualize, analyze, and share your data in a way that is both meaningful and actionable. There are many reasons why you should consider using Power BI, including its data visualization capabilities, data integration features, customizable dashboards, real-time data analysis capabilities, collaboration tools, mobile […]
7 Reasons to Use Microsoft Power BI Read More »