Brush Slicer

The Datellers Brush Slicer is a powerful slicer that lets you seamlessly explore trends, filter time ranges, and uncover insights through interactive brushing and dynamic visualization.
Datellers Brush Slicer logo – a data chart with colored nodes and a filter funnel icon
Brush Slicer intuitive brushing feature – a line chart showing a draggable date range selection between 17 Dec and 22 Dec with highlighted brush overlay

Intuitive Brushing

This feature allows users to select a date range by simply dragging anywhere over the chart. The brush defaults to the entire date range, which can then be narrowed by dragging its handles.

While selecting a date range, users can simultaneously analyse trends and anomalies visible in the underlying chart, making the filtering process more informed and intuitive. The brush can be further customised from the formatting pane, including options for colour and opacity.

Multiple Measures

Most slicers are purely functional. They filter data but show you nothing. Multiple Measures transforms the Brush Slicer into a fully interactive multi-line chart that works as both a visual and a filter simultaneously.

Users can layer two or more metrics, such as Actual vs Target or Budget vs Forecast, directly within the slicer, analyse trends and comparisons across the full date range, and then drag to filter a specific period, instantly updating every other visual on the report page. Analysing and filtering in one single, interactive view.

Period Snapping

When repeatedly filtering data across the same time boundaries, manually aligning the brush to clean year or month intervals can be tedious and imprecise. Period Snapping gives users control over how the brush selection behaves, snapping it automatically to the right boundary every time

The following modes can be selected from the formatting pane:

  • Free: Select any custom date range without constraints
  • Year: Snap the brush to full yearly periods
  • Month: Snap the brush to individual months
Brush Slicer Precision Zooming feature – a dense time series chart zoomed into a selected period between Jun 2013 and Oct 2013, with a range slider for focused data exploration

Precision Zooming

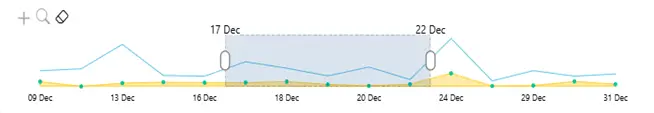
When working with dense time series data, it can be difficult to spot smaller changes and granular trends within a broader date range. Precision Zooming allows users to focus in on any specific period for a closer, more detailed view, making it easier to identify subtle shifts that would otherwise be lost in the noise.
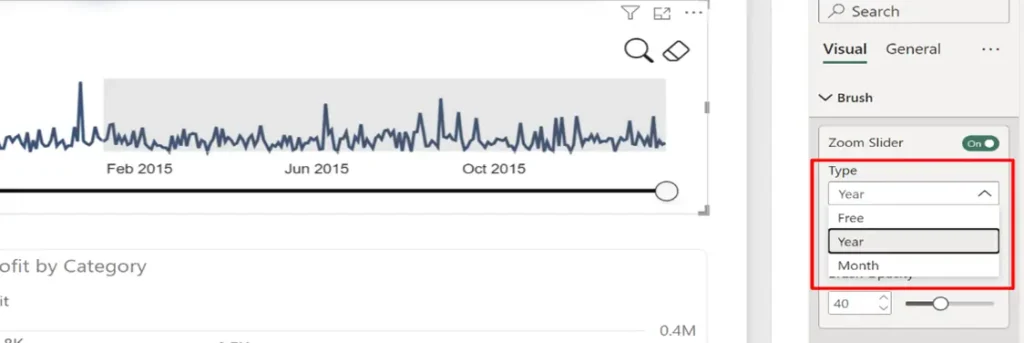
Zooming can be enabled with a single click via the zoom icon, or toggled from the formatting pane.
User Guide

Learn all the features and formatting options that allow you to use the Brush Slicer in all its simple yet powerful ways.

Sample Report

Discover how Brush Slicer makes your data exploration interactive and intuitive with this insightful report showcasing its applications.

Scroll to Top

Get In Touch

Set up a free Consultation today!