As of August 2022, Power BI has added many new features, some of which have been anticipated for a long time. These features have also immensely helped visual developers come one step closer to having the potential to build a visual quite close to an out-of-the-box visual.
We have listed down the Top 10 features that you can add to make your visual much more powerful or efficient.
- Manage Licenses through Microsoft Platforms
- File Download API
- Conditional Formatting
- Fetch More Data
- Total and Subtotal API
- Drilldown and Drillthrough
- Local Storage API
- Display Warning Icon
- Landing Page
- Modern Tooltip Support
1. Manage Licenses through Microsoft Platforms
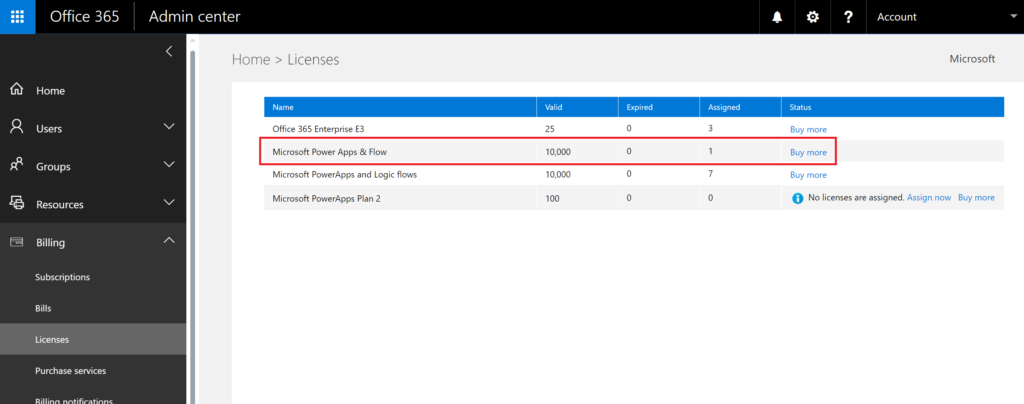
Power BI has finally released a long-awaited feature to support Licensing inside the Microsoft environment itself. Until now, visual owners could only manage and enforce licensing via third-party tools. This imposed quite a few challenges. One is that a certified visual could not be licensed thoroughly since external API calls were forbidden for certified visuals.
However, Power BI visuals can now finally be listed as free or as visuals with additional paid features inside Power BI and AppSource itself. You no longer need to redirect customers to a third party for transaction or license management. Now you can sell, manage, and enforce licenses directly through the commercial marketplace! Read more
2. File Download API
Users can download data from a unique visual into a file on their storage device using the file download API. User approval and admin authorization from the admin global switch is needed in order to download a visual. Download limitations imposed by your organization’s Export and sharing settings are separate from this setting and are unaffected by them. Read more
3. Conditional Formatting
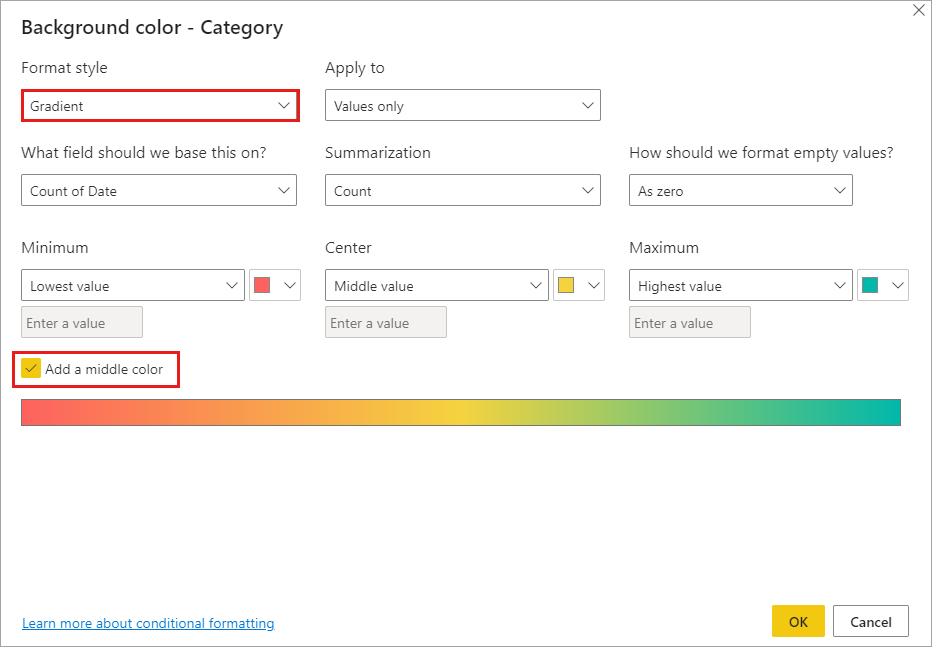
With conditional formatting, a report’s colour appearance can be customised based on a number value. Only the following property types are eligible for conditional formatting:
- Colour
- Text
- Icon
- Web URL
The use of conditional formatting with series is not advised. Instead, you should let customers format each series separately so that it is simple to tell one series from another. The majority of unconventional visual series take this tack. Read more
4. Fetch More Data
The 30K row data view hard restriction can be overcome by Power BI visualisations using the fetch more data API, which supports loading data chunks. The API now supports loading only the incremental data chunks in addition to the prior method of aggregating all the chunks requested.
This method gives the visual more options in how extra data chunks are loaded. You can alter the chunk size to suit your use case and boost performance.
Set a window size for the data reduction algorithm in the visual’s capabilities for the data view segment mode. Read more
5. Total and Subtotal API
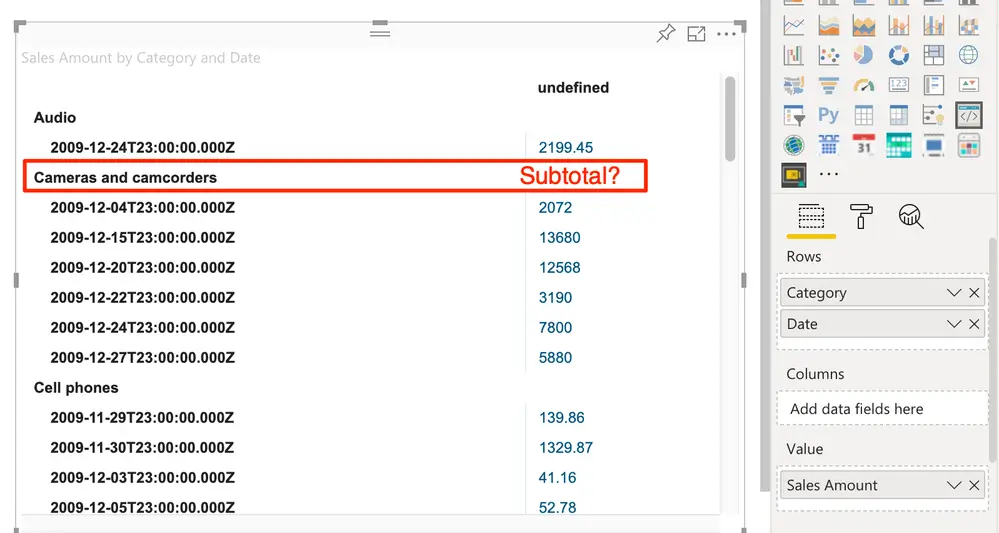
Custom graphics with a matrix data-view can get aggregated subtotal data from the Power BI host using the Total and Subtotal API. You can specify the subtotals for specific levels of the matrix data hierarchy or calculate them for the full matrix dataset.
The Power BI backend receives a data fetch request each time visual updates its data. These data queries often ask for the values of the fields that the user has dragged into the visual’s field wells. Other aggregations or subtotals, like sum or count, may occasionally need to be applied to these variables for the visual. In order to obtain the additional aggregation/subtotal data, the API customises the outgoing data query. These computations are extremely effective and suitable for huge data sets because they are carried out by the Power BI backend. Read more
6. Drilldown and Drillthrough
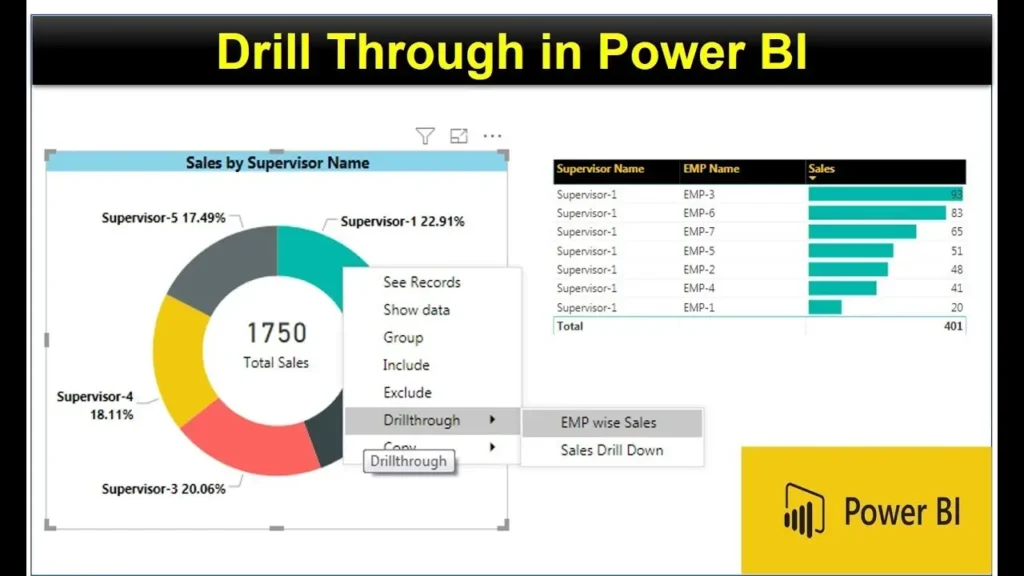
You may designate a destination target page in your Power BI report that focuses on a particular entity, such as a supplier, client, or manufacturer. Right-clicking a data point on one of the source report pages will take readers to the target page, where they can read the information filtered for that context. Power BI Desktop or the Power BI service both allow you to set up drill-through in your reports. Read more
7. Local Storage API
Data can be immediately stored in the local browser using the local storage API. Local data storage increases web app performance and data security. Each sort of visual has a distinct storage access thanks to the isolation of local storage.
8. Display Warning Icon
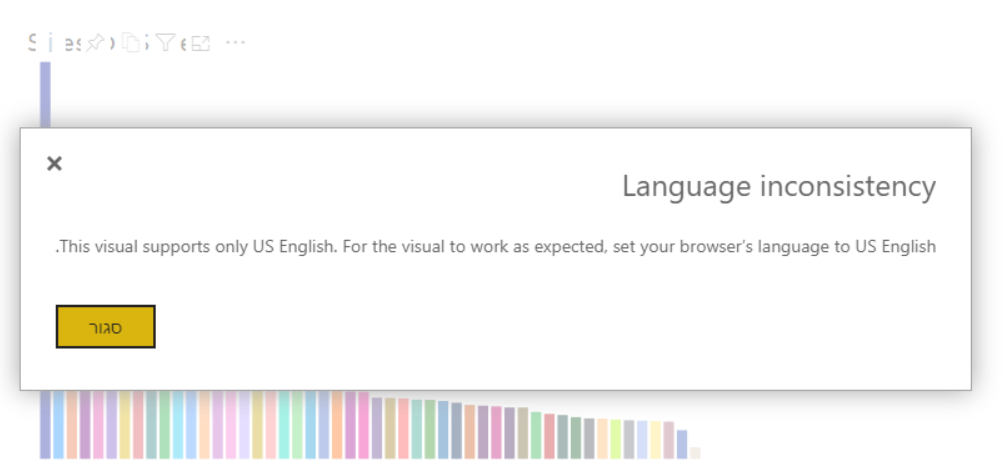
A display warning symbol in a Power BI visual might alert the user to a potential issue or error. For the graphic you’re building, you can create a warning icon with a specific message. You have the choice of raising the warning icon or not.
You must first call the display warning icon method in order to add a display warning icon to your graphic. The method is exposed by powerBi-visuals-API and is a component of IVisualHost. You must then add a condition that specifies when to display the warning icon after adding the import. Take a look at the two optional criteria in the examples below. The PowerBI-visuals-sample bar chart repository’s barChart.ts file contains the complete source code for these examples. Read more
9. Landing Page
You can view the information in your Power BI visual card before it is filled with data on the landing page for that visual. Here are some illustrations of what a visual’s landing page might look like:
- Text that explains how to use the visual
- A link to your website
- A link to a video
10. Modern Tooltip Support
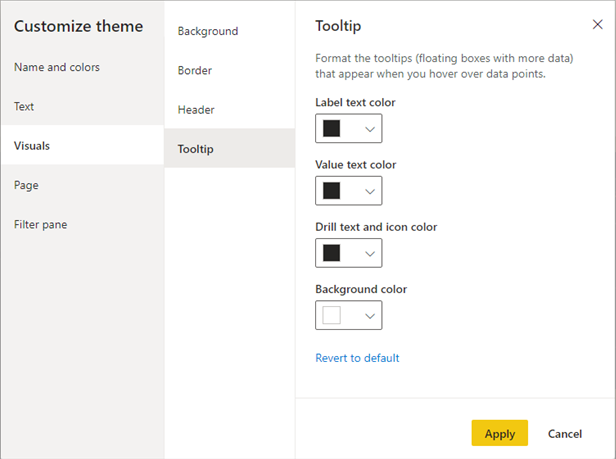
An elegant method of giving data points on a visual more context and detail is using tooltips. A textual element with a title, a value in a specific colour, and opacity at a given set of coordinates can be displayed in tooltips. The Power BI host renders this data in the same manner as it renders tooltips for native visuals after this data is submitted to the API.
By turning on the contemporary tooltips functionality, you can modify the appearance of your tooltips or include drilling actions. The ITooltipService interface allows you to control the tooltips in your visual. The host receives a notification from ITooltipService when a tooltip has to be displayed, deleted, or moved. Read more