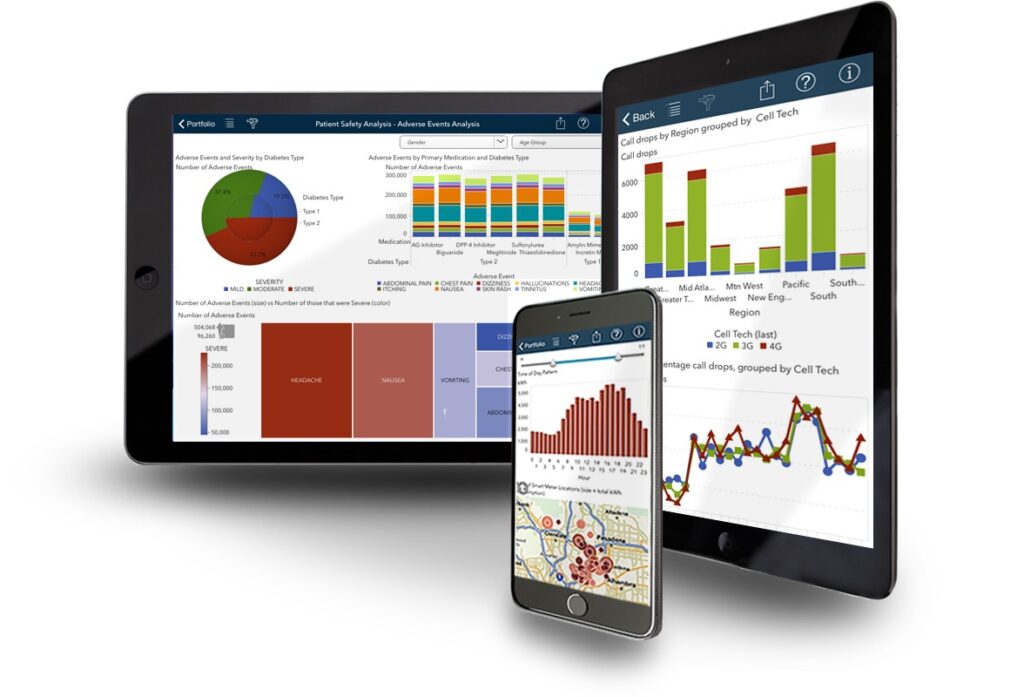
Interactive data visualization for business intelligence and dashboards
Interactive data visualization for business intelligence and dashboards is a powerful tool that helps businesses gain insights and make data-driven decisions. It involves using graphical representations of data that can be interacted with by users to explore and analyze data in real time. This type of visualization allows for creation of dynamic and informative dashboards […]
Interactive data visualization for business intelligence and dashboards Read More »