
Process Mining Visual

The Datellers Process Mining Visual turns your event data into an interactive process map, showing exactly how work flows from first step to last.

Interactive Process Map
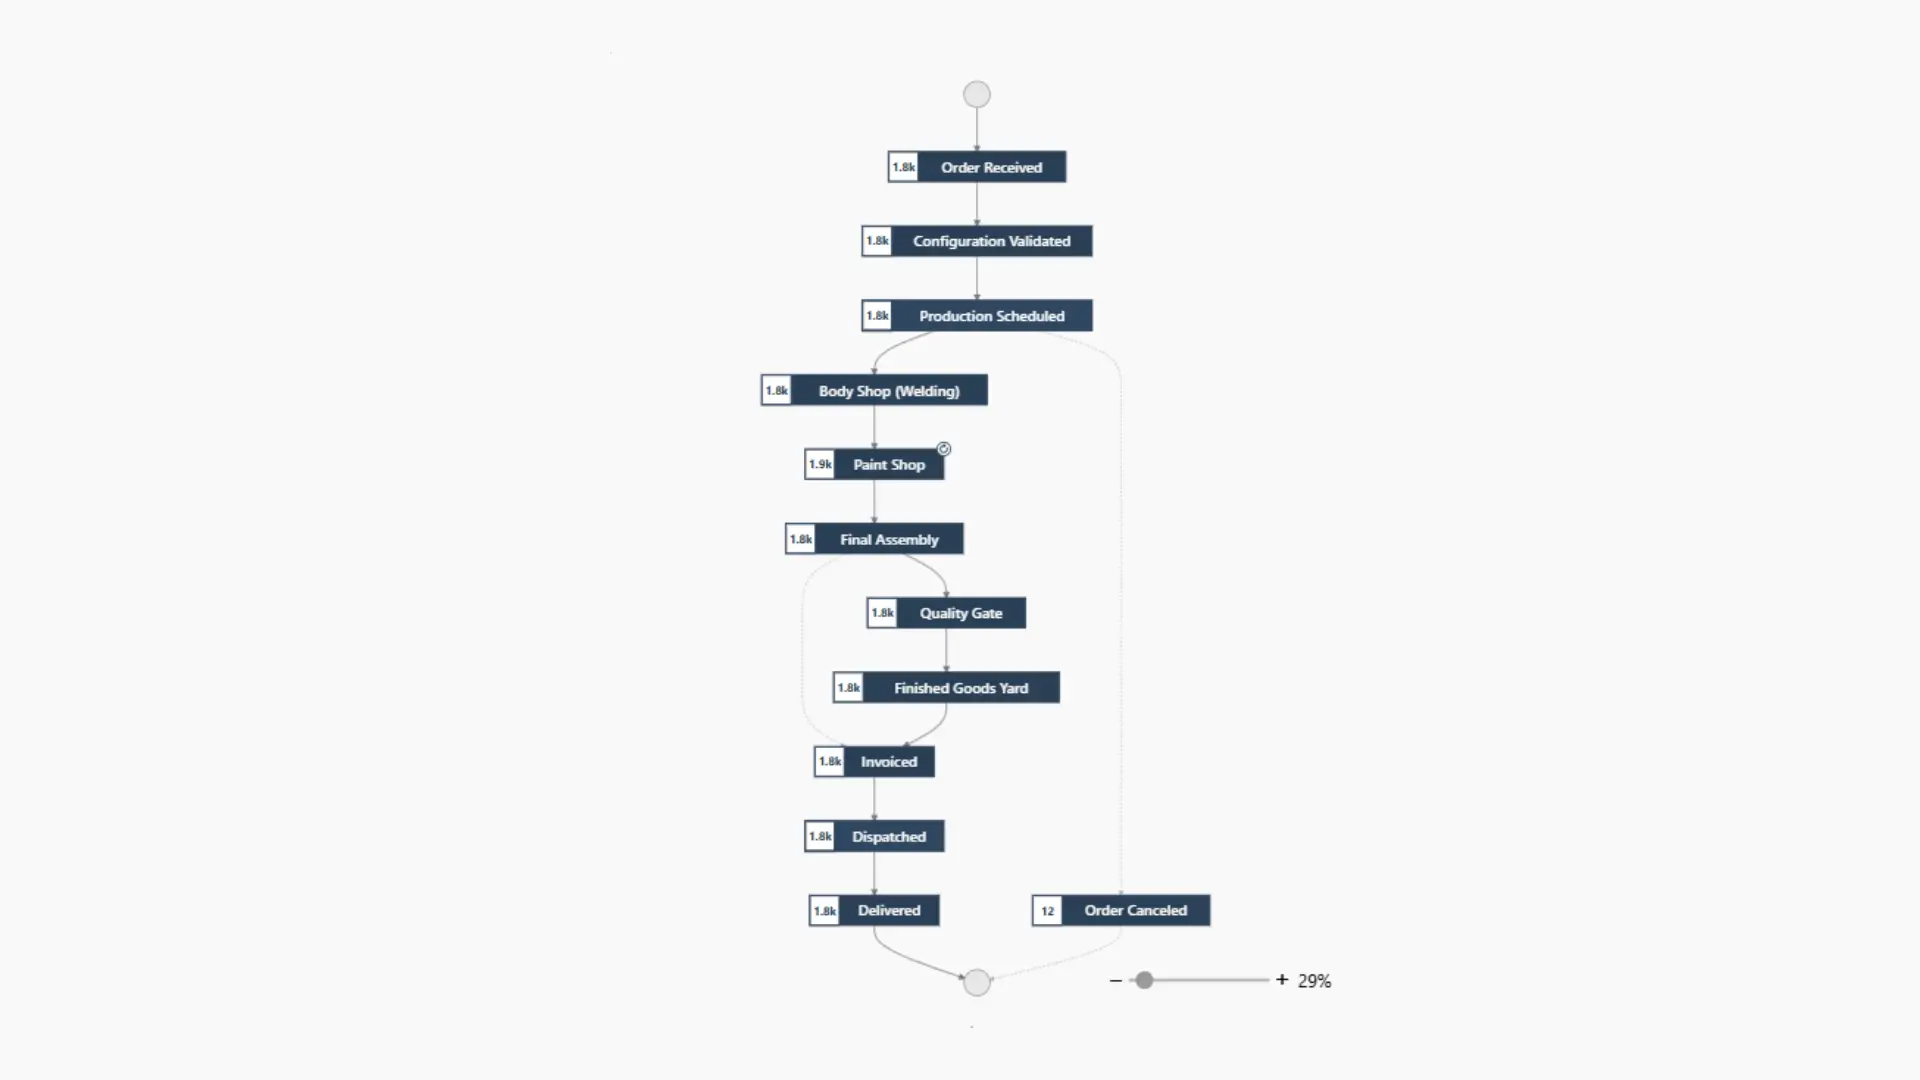
See exactly how your process runs, end to end, in a single connected map. Every activity and transition is visualized, including exception branches like cancellations, so you can spot deviations without digging through tables. Hover any activity to see frequency and average duration instantly.

Golden Path & Variant Analysis

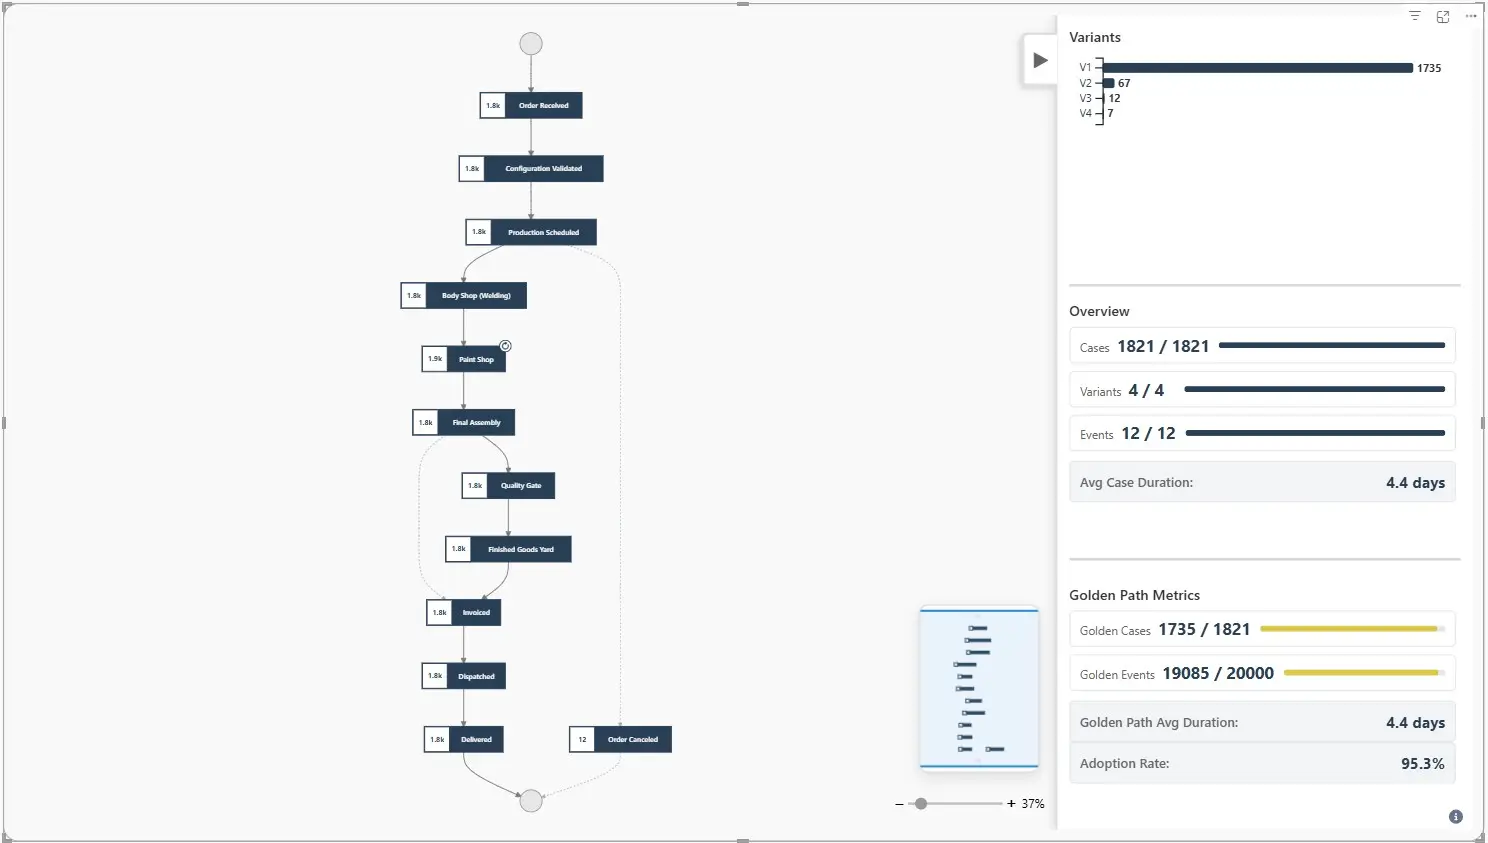
Know at a glance how much of your process runs the way it’s supposed to. The sidebar breaks down every variant with case and event counts, then surfaces a single golden-path adoption rate so compliance gaps are obvious, not buried in a spreadsheet.

Zoom & Minimap Navigation

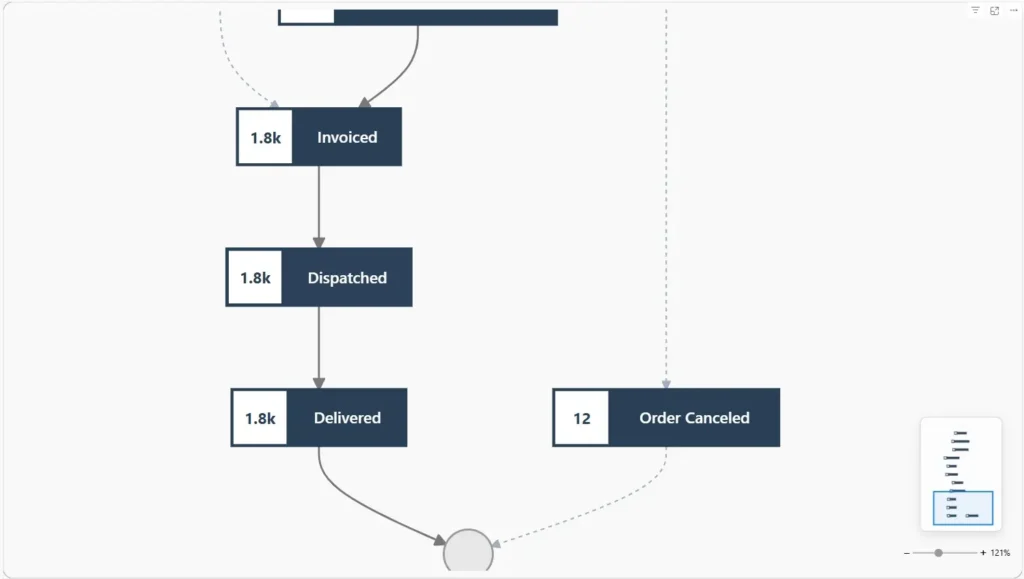
Focus on any part of a large process map without losing your place. Built-in zoom and minimap controls let you dive into a busy section of the flow, then pull back out to see the full picture in one click.
Minimap and zoom slider controls in the Datellers Process Mining Power BI visual, zoomed to 121% for detailed process view

Implementation Guide

Get Started in 6 Simple Steps

Go from raw event data to a working process map in minutes.

01

Import the Visual

Import the Process Mining visual package into your Power BI report.

02

Add Your Case, Activity, and Timestamp Field

Map your Case ID, Activity, and Timestamp columns into the visual's data fields to render the process map.

03

Explore the Process Map

Hover over any activity node to see frequency and average duration; follow the map from first step to last, including any exception branches.

04

Review Variants and Golden Path

Open the sidebar to compare variants and see the golden-path adoption rate for your process.

05

Zoom and Navigate

Use the zoom controls and minimap to focus on any part of a large process map.

06

Format to Match Your Report

Use the Format pane to adjust colors, layout, and display options so the map matches your report theme.

User Guide

Learn all the features and formatting options that allow you to use the Process Mining visual in all its powerful ways.

Sample Report

Discover how the Process Mining visual can transform your process storytelling with this insightful report.

Industry Applications

How Process Mining Visual works across industries

See the real path your work takes, wherever a process runs through multiple steps and handoffs.

Order-to-delivery, mapped end to end

Track how orders move from received to delivered across plants and segments, spotting bottlenecks and exception branches like cancellations before they affect cycle time.

Scroll to Top

Get In Touch

Set up a free Consultation today!

Great! We’ve received your information.