Contents:
- What is a Nested Total Bar Chart?
- Nested Total Bar Chart Use Cases
- How to use the Nested Total Bar Chart in Power BI
- Formatting Options in the Nested Total Bar Chart
I. What is Nested Total Bar Chart?

The Nested Total Bar Chart, an alternative to the stacked bar chart, organizes bars to display a total at the top of each group, simplifying the comparison between individual segments and their overall total. This design improves clarity by distinguishing the total value from the individual components, making comparisons more intuitive. It’s especially useful for maintaining a clean, simple visual while clearly highlighting both individual contributions and the total within each category.
- Clear Comparison to Total: The total value for each group is explicitly shown in the total bar, making it easy to compare individual bars to the overall total.
- Improved Readability: Unlike stacked bars, which can become cluttered, the nested design keeps the total separate from the individual segments, enhancing clarity.
- Accurate Contribution Analysis: The total bar clearly shows how each individual data point contributes to the overall total, making it easier to interpret proportions across categories.
Inspiration
LinkedIn conversations among Power BI users have repeatedly pointed out issues with stacked bar charts—visual clutter, difficulty interpreting totals versus segments, and limited clarity. Experts like Kevin Flerlage, Sebastine Amede, and Darragh Murray have shared ideas and alternatives to address these challenges, sparking valuable community discussions. These ongoing conversations inspired Datellers to rethink this common visual challenge.
Datellers responded by creating the Nested Total Bar Chart, designed to clearly separate totals from individual segments, enhancing both readability and comparison accuracy. This visual solution combines the benefits of stacked bar charts while reducing their complexity, making it easier for users to grasp insights quickly.
The product itself is a Microsoft-certified, free-to-use Power BI custom visual that requires no complex setup or helper columns. It’s plug-and-play, scalable, and best suited for datasets with five or fewer groups to maintain clarity. This visual empowers business users to showcase detailed contribution data alongside clear totals, helping decision-makers focus on what matters most with clean, intuitive design.
Structure of the Nested Total Bar Chart
X-Axis (Categories): Categories form the horizontal axis and represent your primary grouping dimension in the chart. They appear as distinct vertical columns, with each column displaying both a total bar and nested sub-category bars. Examples include time periods (months, quarters), departments, regions, projects, or any categorical grouping. The visual automatically calculates bandwidth and spacing to distribute categories evenly across the chart width.
Y-Axis (Values): Values represent the quantitative measurements displayed vertically using a linear scale. The Y-axis dynamically calculates its domain based on the minimum and maximum values in your dataset, supporting both positive and negative numbers. Values are rendered as bar heights, with formatting options for units (e.g., K, M, B), decimal precision, and display formats (currency, percentage, etc.). The scale adjusts automatically to accommodate your data range within the available viewport height.
Legend (Series): The legend defines series that create nested bars within each category column. Each legend value becomes a separate bar positioned inside its parent category using a secondary bandwidth scale (x1). For example, if your legend contains product types, each category column will show individual bars for each product with colors mapped from the legend. Series data enables multi-dimensional analysis by breaking down category totals into their constituent components.
Additional Elements
Nested Bars: Inner bars positioned within category columns using the secondary scale, displaying individual series values. Each nested bar inherits its color from the corresponding legend entry, creating visual consistency throughout the chart. Nested bars enable detailed analysis of series contributions while maintaining contextual awareness of the total value.
Category Labels: Descriptive text labels positioned below the chart displaying category names. Labels support comprehensive text formatting including font family selection, size adjustment, bold/italic/underline styling, custom colors, and text wrapping functionality. The visual automatically measures rendered label heights and adjusts bottom margin spacing to prevent truncation or overlap.
Data Labels: Numeric value labels displayed on individual bars with intelligent collision detection algorithms. The density control parameter enables selective display of labels for the top N% of bars based on absolute value magnitude, preventing visual clutter in dense datasets. Labels can display either absolute values or percentage-of-total calculations, with full formatting control including units and decimal precision.
Total Labels: Dedicated labels for aggregate values that can be positioned either above or below total bars. These labels provide immediate visibility into category-level metrics without requiring axis reference, supporting rapid data comprehension.
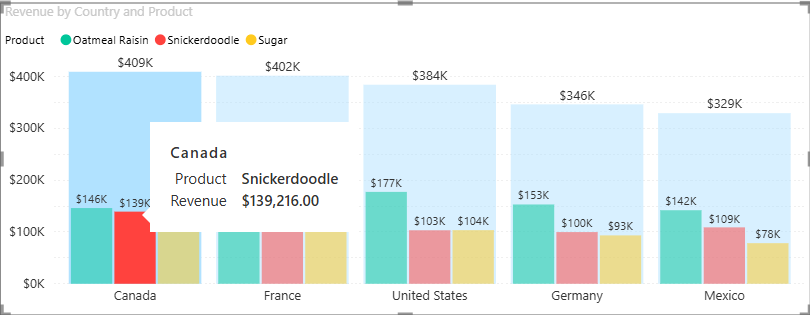
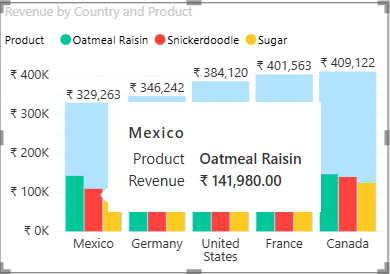
Tooltips: Interactive hover information that displays contextual details for any chart element without permanently occupying visual space. Tooltips support Power BI’s standard and enhanced tooltip functionality, enabling custom tooltip pages for comprehensive data exploration.
II. Nested Total Chart Use Cases
- Sales Performance Analysis: Analyse total sales by region while simultaneously viewing product category breakdowns, identifying which products drive performance in each geographic market and revealing opportunities for category expansion or optimization.
- Financial Budget Tracking: Monitor departmental budget allocations with detailed expense category visibility, tracking spending patterns across cost centres and identifying areas of budget overrun or underutilization at both aggregate and line-item levels.
- Project Milestone Tracking: Track overall project progress across time periods (months, quarters) while monitoring individual task completion within each period, providing visibility into both schedule adherence and task-level execution status.
- Revenue Stream Analysis: Compare total revenue by business unit with breakdowns by revenue stream (products, services, subscriptions), identifying the composition of revenue generation and highlighting dependencies or diversification opportunities.
- Resource Allocation Management: Visualize total resource allocation across departments with breakdowns by resource type (personnel, equipment, budget), ensuring balanced distribution and identifying potential resource constraints or surplus capacity.
- Performance Metrics Dashboard: Analyse team or organizational performance across multiple time periods with individual contributor or sub-team visibility, supporting both aggregate performance assessment and individual recognition or intervention.
- Inventory Management: Track total inventory levels by warehouse location with product category breakdowns, enabling optimization of stock distribution and identification of overstocked or understocked categories in specific locations.
III. How to Use the Nested Total Chart in Power BI?
- Add the Required Data to Data Fields
The Nested Total Chart requires data assignment across three primary data roles:
X-Axis (Category) – Assign the categorical field that defines your primary grouping dimension. This field creates the vertical columns of the chart and determines the horizontal organization of data. Examples include date hierarchies, geographic dimensions, department names, or project phases.
Y-Axis (Values) – Assign the numeric measure that represents the quantitative metric to be visualized. This field must contain numerical data and determines bar heights. Examples include sales amount, budget values, task counts, or performance scores.
Legend – Assign the categorical field that defines the series breakdown within each category. This optional field creates the nested bar structure. When omitted, only total bars are displayed. Examples include product categories, expense types, task types, or customer segments
- Explore the Following Features
- Dual-Layer Visualization: The chart automatically renders both total bars (aggregate values) and nested bars (series breakdowns) when legend data is provided. Total bars span the full category width with configurable transparency, while nested bars use a proportional secondary scale for positioning. This dual-layer approach ensures both summary and detail remain visible simultaneously.
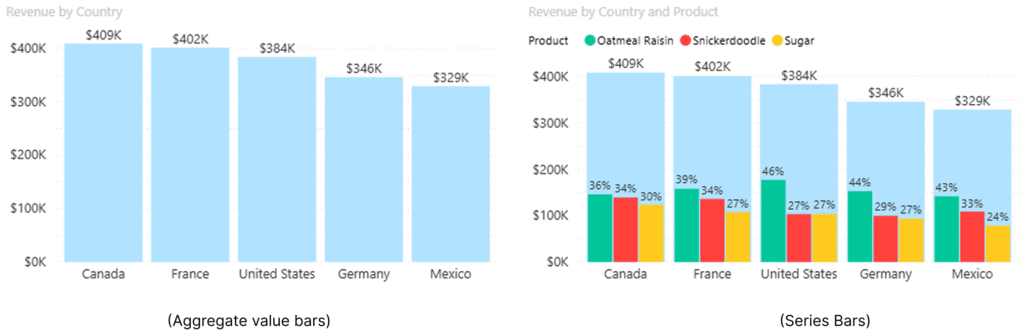
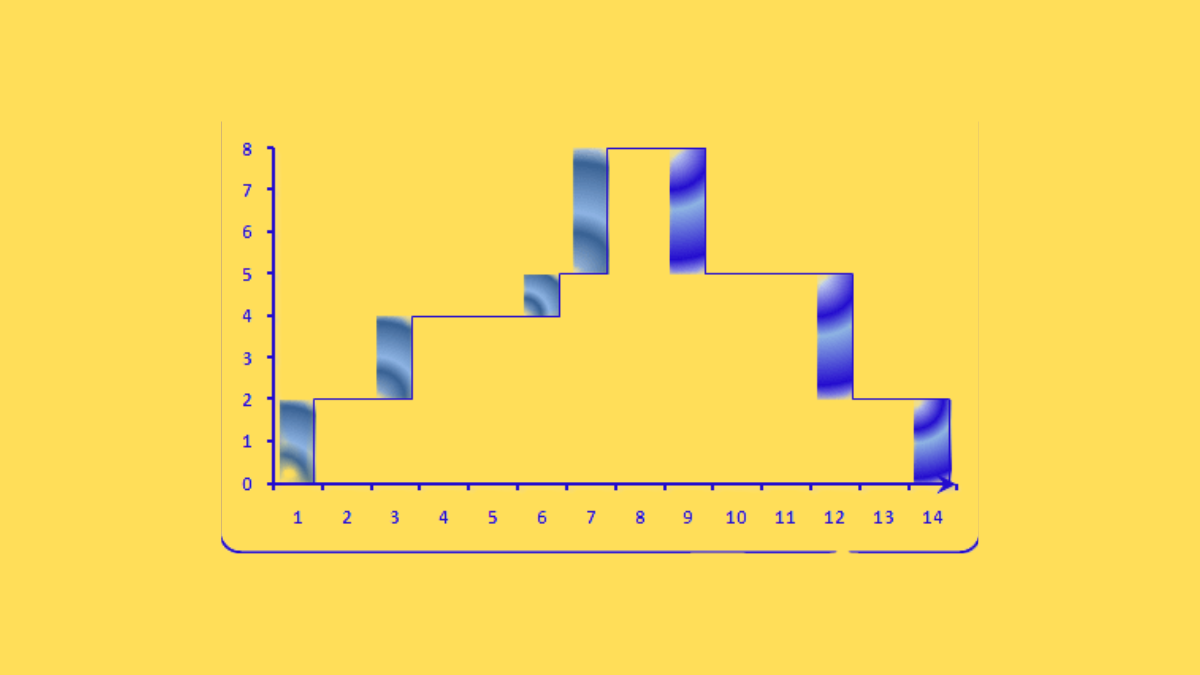
(Nested Total Bar Chart)
- Interactive Selection Capabilities: Users can click any bar or category label to create selections that cross-filter other visuals on the report page. Hold Ctrl while clicking to select multiple elements. Selections synchronize across total bars, nested bars, and category labels, providing consistent interaction behaviour. Click the chart background to clear all selections.
- Intelligent Label Management: The visual employs collision detection algorithms to prevent data label overlap. The Label Density parameter (0-100%) controls the percentage of bars that display labels, automatically selecting bars with the highest absolute values. This ensures that the most significant data points receive label emphasis while maintaining visual clarity.
- Dynamic Scaling and Formatting: The Y-axis automatically adjusts its scale domain based on data ranges, supporting both positive and negative values. All numeric labels (axis, data, totals) support display unit formatting (None, Thousands, Millions, Billions) and decimal precision control, ensuring appropriate data representation for varying magnitude ranges.
- Conditional Formatting Support: Apply Power BI conditional formatting rules to total bar colours, enabling dynamic colour assignment based on measure values, rules, or field values. This capability supports heatmap-style visualizations where colour intensity indicates performance levels or status categories.
- Comprehensive Tooltip Integration: The visual supports both standard Power BI tooltips (displaying field values) and enhanced tooltip pages (custom report pages displayed on hover). Tooltips provide additional context without cluttering the main visualization, supporting detailed data exploration.

- Full Design Customization: Every visual element—bars, labels, axes, gridlines, and legend—offers extensive customization options including colors, fonts, sizing, spacing, and visibility controls. This flexibility ensures the chart can be tailored to match organizational branding standards and specific analytical requirements.
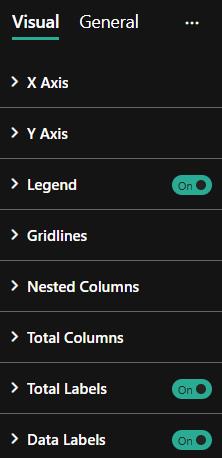
IV. Formatting Options in the Nested Total Chart
The Nested Total Chart provides extensive formatting capabilities accessible through the ‘Format Visual’ pane, enabling comprehensive customization beyond the standard General formatting options available to all Power BI visuals.
- X-Axis (Categories) – Expanding ‘X-Axis’ provides the following formatting options:
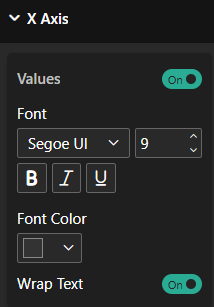
- Values – Toggle X-Axis visibility
- Font Style – Style category labels with font family and font size ,colour etc..
- Wrap Text – Toggle ON or OFF to wrap the category text
- Y-Axis (Values) – Expanding ‘Y-Axis’ provides the following formatting options:

- Values – Toggle Y-axis visibility
- Font Style – Style category labels with font family and font size ,colour etc..
- Display Units – Set value scaling (None, Thousands, Millions, Billions, Trillions)
- Value Decimal Places – Control decimal precision for axis labels
- Legend – Expanding ‘Legend’ provides the following formatting options:
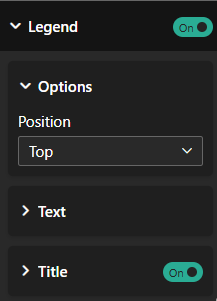
- Show – Toggle legend visibility on or off
- Options – Expand Options:
- Position – Set legend placement (Top, Bottom, Left, Right, Top Center, Bottom Center, Left Center, Right Center)
- Text – Style the legend text with font family, font size and colour
- Show Title – Toggle legend title display
- Grid Lines – Expanding ‘Grid Lines’ provides the following formatting options:
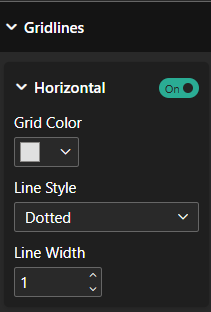
- Horizontal – Toggle horizontal gridline visibility
- Grid Colour – Set colour for gridline strokes
- Line Style – Select gridline appearance (Solid, Dashed, Dotted)
- Nested Columns – Expanding ‘Nested Columns’ provides the following formatting options:
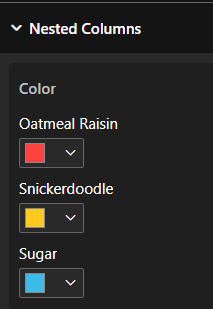
- Column Colour – Set default colour for nested bars (overridden by legend colour when legend is present)
- Total Columns – Expanding ‘Total Columns’ provides the following formatting options:
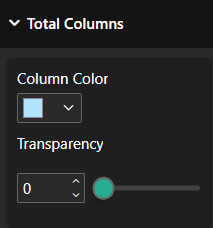
- Column Colour – Set colour for total aggregate bars
- Transparency – Adjust opacity of total bars (0-100%), enabling nested bars to remain visible through semi-transparent totals
- Total Labels – Expanding ‘Total Labels’ provides the following formatting options:
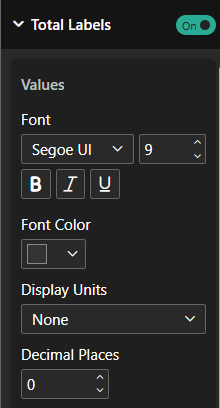
- Font Style – Style category labels with font family and font size, colour ,etc..
- Display Units – Set value scaling (None, Thousands, Millions, Billions, Trillions)
- Decimal Places – Control decimal precision for axis labels
- Data Labels – Expanding ‘Data Labels’ provides the following formatting options
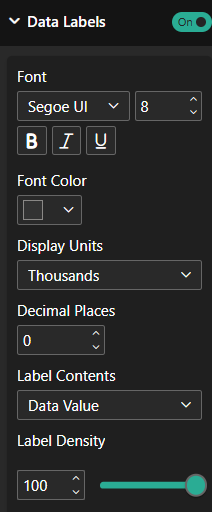
- Show Values – Toggle data label visibility
- Style Font – Style Data labels with font family and font size and colour
- Display Units – Set value scaling (None, Thousands, Millions, Billions, Trillions)
- Decimal Places – Control decimal precision for axis labels
- Label Contents – Select display format (Data Value shows absolute values, Percent of Total shows contribution percentage)
- Label Density – Control percentage of bars displaying labels (0-100%), showing highest-value bars first