As we live in a data-driven era, it is hardly unexpected that analytics is a flaming hot topic right now. Analytics is the study, interpretation, and processing of data. However, there are many tools available for data and business analysts to pick from, making it difficult to select the right one for each project.
Today, by concentrating on Power BI, a Microsoft analytics product, we will do our part to facilitate that decision. Before learning how to learn Power BI, let’s start with the fundamentals.
When to use power BI?
What is Power BI?

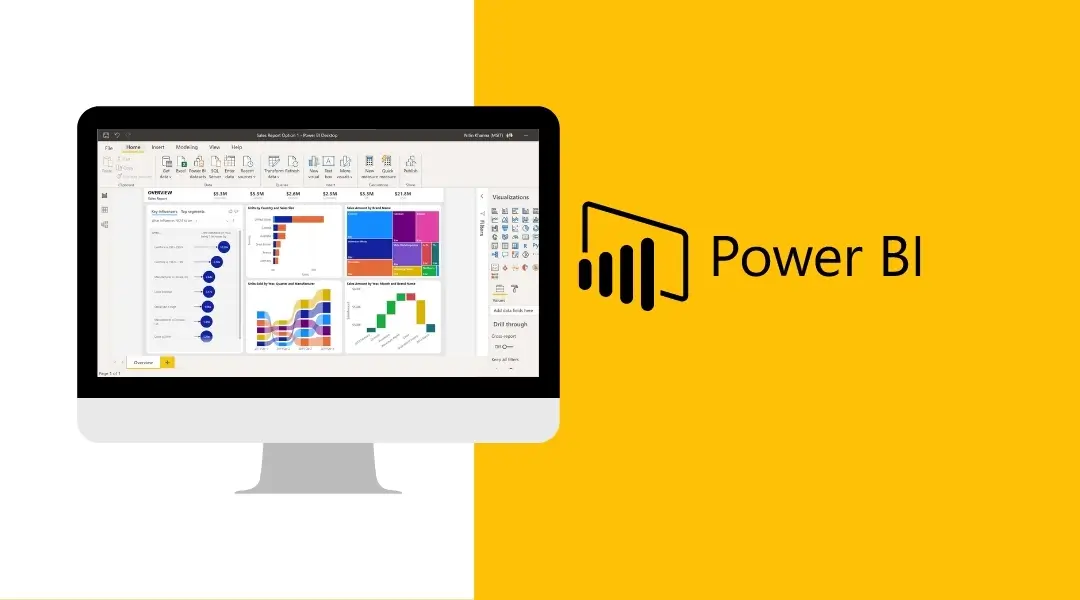
Making shareable reports, dashboards, and applications allows us to visualise and analyse the data from the datasets entered into Power BI. Power BI is an easy-to-use application with powerful drag-and-drop functionality and self-service options. Three different Power BI platforms are provided by Microsoft:
-
- Power BI Desktop (A desktop application)
- Power BI Service (SaaS i.e., Software as a Service)
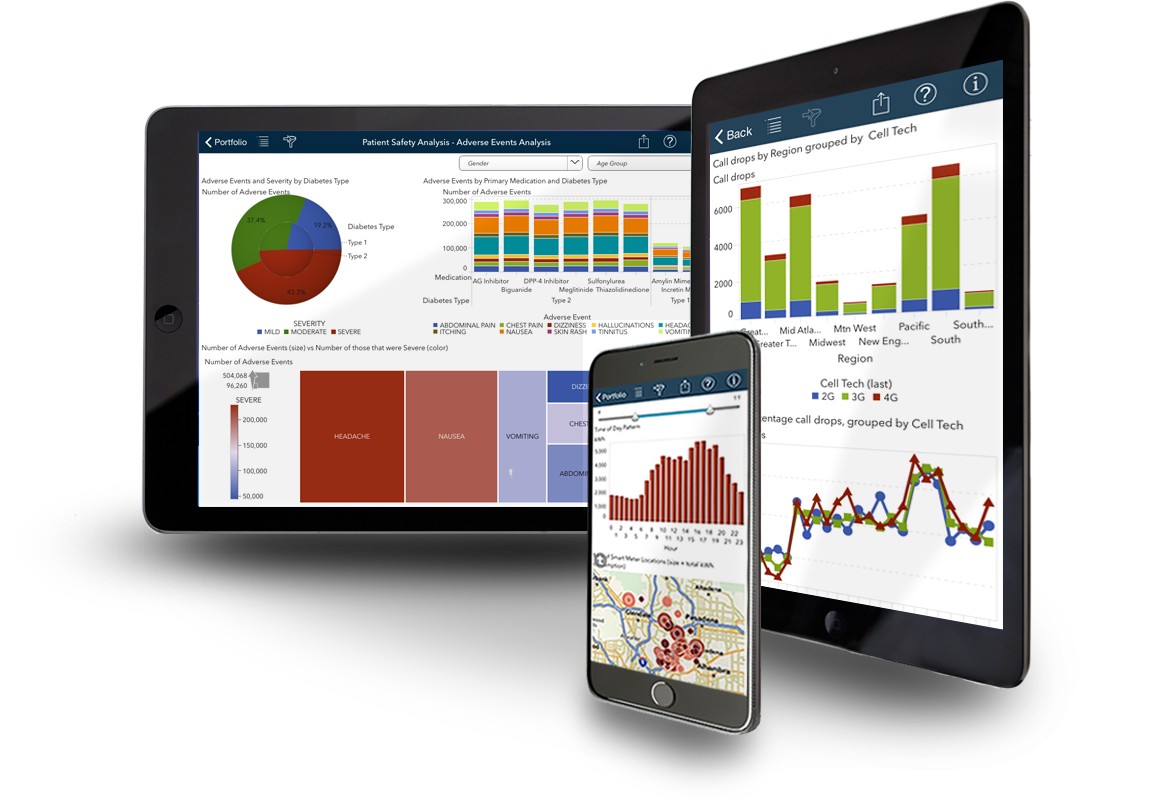
- Power BI Mobile (For iOS and Android devices)
How to become certified in Power BI
Although Power BI has a user-friendly graphical user interface, there is a great deal of complexity hidden beneath it. It’s simple to think you understand Power BI after watching videos or reading guides. But you’ll need practical skills if you want to ace the test and become job-ready.Making projects is the best approach to developing practical Power BI abilities. You will gain expertise doing everything from loading data to cleaning it to visualising it through projects that reflect real-world data analysis.
Step 1: Get familiar with the interface
Step 2: Build some visualizations!
Step 3: Model and clean data
Step 4: Publish your reports
Step 5: Build a project portfolio
Power BI Architecture
1. Data Integration

We can import data from several sources into Power BI in a variety of forms. Power BI gathers data (extracted from many data sources) in the data integration process and transforms it into a common format. Data is kept in a shared storage space called the staging area after it has been integrated into Power BI.
2. Data Processing

The raw data needs some processing after Power BI integrates and stores the data in a safe location. The raw data is transformed by a number of processing or cleansing activities, such as deleting redundant values, etc. The processed data is afterwards transformed in accordance with our business requirements by the application of pertinent business rules. The data loader receives these altered data warehouses.
Also read: Business Benefits of Using Power BI
3. Data Presentation

In this last stage, reports, dashboards, and scorecards are created using the processed data that has been moved from the warehouse and entered into Power BI platforms like Power BI Desktop. Power BI has a large selection of visualisations. Additionally, we can purchase customised visualisation from the market. To share the reports with other business users, we can publish them from the platforms for report generation on the web or via mobile apps.
How to Use Power BI
The best place to start when learning how to utilise Power BI is by being familiar with its many components. Even for those who don’t consider themselves to be highly tech-savvy, Power BI is beautiful in how simple it is to use.You may use Power BI to process the data, produce the required reports, and distribute them to the appropriate teams or individuals as long as you have access to the data sources, the dashboard, and a functioning network connection. And don’t forget that if you’re not ready for anyone outside of your company’s firewall to see the reports just yet, you have the option of using the Power BI Report Server!

